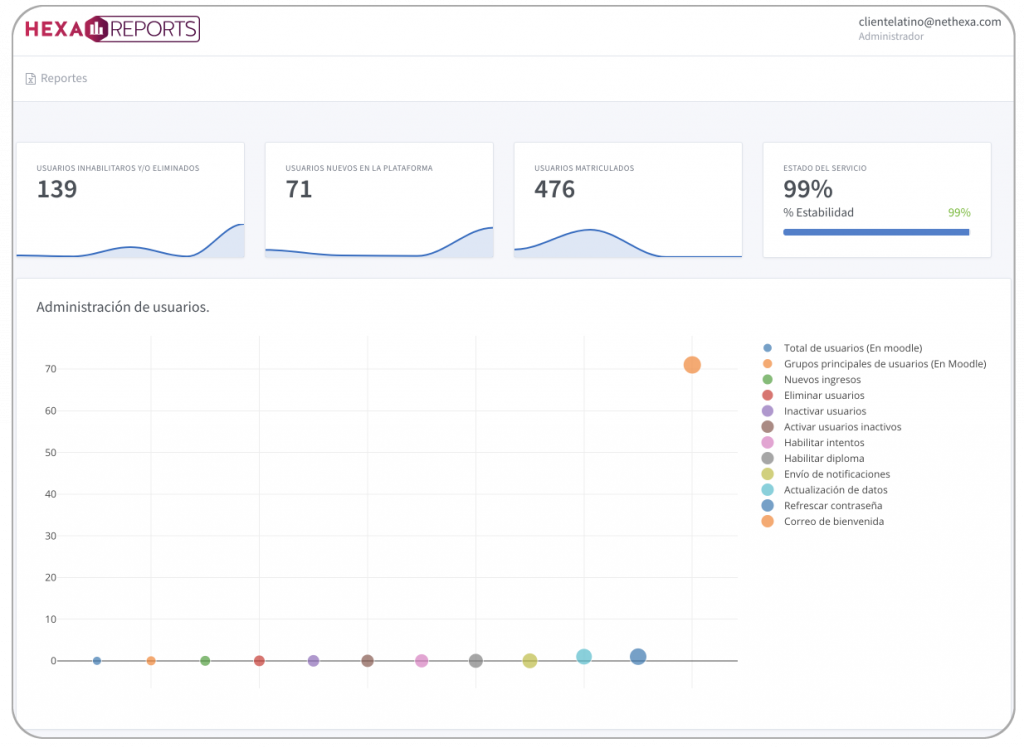
HexaReports is a tool that allows you to capture information from different sources and process it in a visually pleasing and easy to manage way. As a result, you will be able to get all the information you need at a glance. With the help of this tool, you can enter the world of business intelligence with accurate information coming directly from your business telephony, call centre or virtual education solutions.
HexaReports

Business Intelligence (BI) encompasses the strategies and technologies used by companies to analyze business information data. BI technologies provide historical, current and predictive views of business operations. Their goal is to enable straightforward interpretation of this big data. As a result, identifying new opportunities and implementing an effective insights-based strategy can provide companies with a competitive advantage in the marketplace and long-term stability.
Specialized reports for Virtual Education
Through HexaReports, it is possible to obtain metrics of the courses and their participants in real-time or by requesting a recurring report. These are some of the metrics we can get.


Exam scores
Test scores are the obvious first choice to reveal how well learners retain information.
Pre- and post-course surveys
Surveying online course participants is a more personal way to determine the effectiveness of e-learning and can be invaluable in measuring course success. LMS administrators can evaluate how successful a course was in helping learners achieve their goals.
Course completion
Course completion rate is one of the most common metrics used by companies when measuring e-learning effectiveness, as it provides a wealth of information about a course’s performance.
The above metrics are just a small sample of tools you can use to measure the success of an eLearning course or program. Some other eLearning reporting metrics include:
- Usage rates per course.
- Course material utilization rates (available vs usage ratio)
- The ratio of enrollees vs attendance per course
- The ratio of enrollees vs attendance per course, using a full set of metrics.
In addition to analyzing test scores, pre-and post-training surveys, your company can accurately determine the effectiveness of your eLearning courses.
Specialized Call Center Reporting
We have experience in implementing reporting tools at all levels. We offer solutions for all types of Call Centers, from the largest to the smallest. Our tools will allow you to have total control over your call processes and statistics. You will also be able to see the performance of your agents and take action quickly and efficiently.
- Queue Distribution.
- Distribution by Month, Week, Day, Weekday and Hour.
- Calls Answered by Queue, Agent, URL and Duration.
- Service Levels for Attended and Unattended.
- Disconnection Causes for Attended and Unattended.
- Transferred Calls.
- Unattended Calls by Queue and by URL.
- Agent Sessions, Pause Duration and Availability.
- Among others.

Each report can export and download the displayed information to PDF or CSV (comma separated values) to be opened as a spreadsheet.
PDF files represent the same information with moderate colours for better visualization. CSV files allow you to use each data to perform your calculations.
As a Manager, you can eavesdrop on (or listen to) calls in the process. You can also use the whisper method to talk to your agent without the other end being able to hear you, or you can steal an agent’s call from the RealTime view.
You can customize your reports with your metrics and formulas – no code required. Again, no coding is needed, all from within the online tool.
This tool allows you to create, modify and delete as many users as you need, assign different roles to each user and define which queues and agents can be displayed.
As Asterisk numbers each queue and agents are also defined by their device or channel, we have created this selector, which will allow you to display the queue and agent names in a more understandable and identifiable way.

